Relational Datasets

Megha Joshi

A Data Frame

  • Data frames represent data as a table with rows and columns

    • Rows represent observations or record (e.g., each row contains data on employee)

    • Columns typically contain variables (e.g., columns contain information like score on employee satisfaction survey, what department the employee belongs to etc.)

  • A tibble is a modern data frame - Chapter 10 of R4DS

# A tibble: 8 × 4
  dept_id dept_name emp_id surv_scr
  <chr>   <chr>      <int>    <dbl>
1 A       Analytics      1       73
2 A       Analytics      2       75
3 A       Analytics      3       90
4 A       Analytics      4       79
5 B       Research       5       86
6 B       Research       6       83
7 B       Research       7       83
8 B       Research       8       85

Limitations of Data Frames

  • Redundant information

    • In the example data, note that department name repeats ~ same information is repeated across 4 rows
  • Storage and memory issues

# A tibble: 8 × 4
  dept_id dept_name emp_id surv_scr
  <chr>   <chr>      <int>    <dbl>
1 A       Analytics      1       73
2 A       Analytics      2       75
3 A       Analytics      3       90
4 A       Analytics      4       79
5 B       Research       5       86
6 B       Research       6       83
7 B       Research       7       83
8 B       Research       8       85

Relational Data

  • Like data frames but now we split the data into multiple tables

  • Cut redundant information, optimize storage and memory, organize the information better

Employee data:

# A tibble: 12 × 3
   emp_id surv_scr dept_id
    <int>    <dbl> <chr>  
 1      1       73 A      
 2      2       75 A      
 3      3       90 A      
 4      4       79 A      
 5      5       86 B      
 6      6       83 B      
 7      7       83 B      
 8      8       85 B      
 9      9       81 C      
10     10       83 C      
11     11       90 C      
12     12       84 C      

Department data:

# A tibble: 4 × 2
  dept_id dept_name
  <chr>   <chr>    
1 A       Analytics
2 B       Research 
3 D       HR       
4 E       Admin    

Databases

  • Collection of multiple data

  • Database Management System

    • MySQL

    • DuckDB

Example Dataset Full

employee_dat
# A tibble: 12 × 3
   emp_id surv_scr dept_id
    <int>    <dbl> <chr>  
 1      1       73 A      
 2      2       75 A      
 3      3       90 A      
 4      4       79 A      
 5      5       86 B      
 6      6       83 B      
 7      7       83 B      
 8      8       85 B      
 9      9       81 C      
10     10       83 C      
11     11       90 C      
12     12       84 C      
department_dat
# A tibble: 4 × 2
  dept_id dept_name
  <chr>   <chr>    
1 A       Analytics
2 B       Research 
3 D       HR       
4 E       Admin    

Primary Key

  • Every table needs to have a primary key. This would be a unique identifier for each of the rows.

  • Has to be unique - no duplicated key

    • Possible to concatenate two or more variables to create a primary key
  • Should not have missing data for primary key - we need an identifier

    • Example:

      • Employee ID in the employee dataset (`employee_dat`)

      • Department number in the department dataset (`department_dat`)

Foreign Keys

  • Counterpart to the primary key

  • An identifier in a another table that matches with the primary key in a table

    • Example:

      • Department number is a foreign key in employee_dat that matches with the primary key department number in the department_dat
employee_dat
# A tibble: 12 × 3
   emp_id surv_scr dept_id
    <int>    <dbl> <chr>  
 1      1       73 A      
 2      2       75 A      
 3      3       90 A      
 4      4       79 A      
 5      5       86 B      
 6      6       83 B      
 7      7       83 B      
 8      8       85 B      
 9      9       81 C      
10     10       83 C      
11     11       90 C      
12     12       84 C      
department_dat
# A tibble: 4 × 2
  dept_id dept_name
  <chr>   <chr>    
1 A       Analytics
2 B       Research 
3 D       HR       
4 E       Admin    

Mutating Joins

Full Outer Join

Join all the rows of both tables as long as there is a matching record in either table.
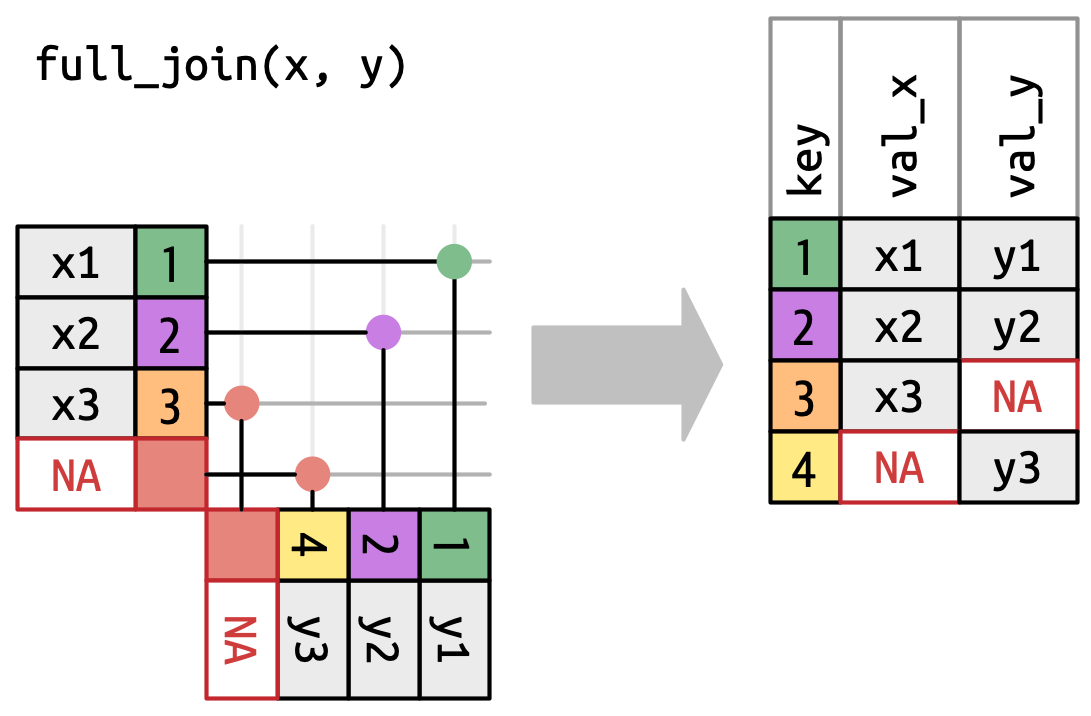
Chart showing how full join works. Left side table has key id 1, 2, 3 and variable x 1, 2, 3. The right side table has id 1, 2, 4 and variable y 1, 2, 3. The joined data has all 4 ids, for id 3, y is NA and for id 4, x is NA.

full_join()

full_join(employee_dat, department_dat, by = "dept_id")
# A tibble: 14 × 4
   emp_id surv_scr dept_id dept_name
    <int>    <dbl> <chr>   <chr>    
 1      1       73 A       Analytics
 2      2       75 A       Analytics
 3      3       90 A       Analytics
 4      4       79 A       Analytics
 5      5       86 B       Research 
 6      6       83 B       Research 
 7      7       83 B       Research 
 8      8       85 B       Research 
 9      9       81 C       <NA>     
10     10       83 C       <NA>     
11     11       90 C       <NA>     
12     12       84 C       <NA>     
13     NA       NA D       HR       
14     NA       NA E       Admin    

Left Outer Join or Left Join

Join all the rows of the left table and the matching rows in the right table.
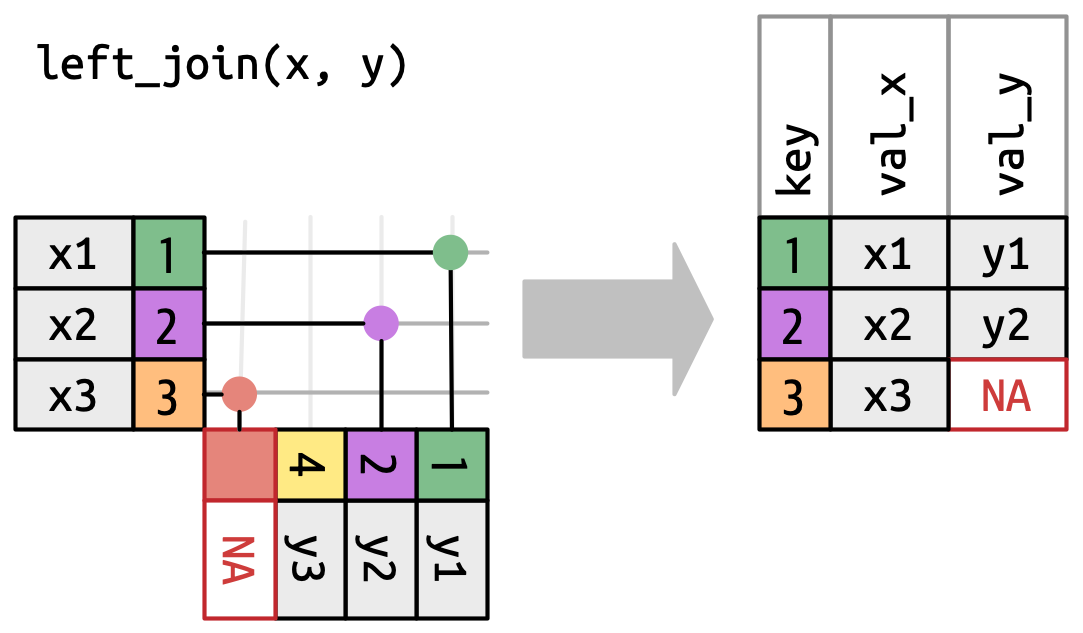
Chart showing how left join works. Left side table has key id 1, 2, 3 and variable x 1, 2, 3. The right side table has id 1, 2, 4 and variable y 1, 2, 3. The joined data has all ids from left side table, 1, 2, 3, along with x1, 2, 3, ids 1 and 2 have y 1 and 2 and for id 3, y is NA.

left_join()

left_join(employee_dat, department_dat, by = "dept_id")
# A tibble: 12 × 4
   emp_id surv_scr dept_id dept_name
    <int>    <dbl> <chr>   <chr>    
 1      1       73 A       Analytics
 2      2       75 A       Analytics
 3      3       90 A       Analytics
 4      4       79 A       Analytics
 5      5       86 B       Research 
 6      6       83 B       Research 
 7      7       83 B       Research 
 8      8       85 B       Research 
 9      9       81 C       <NA>     
10     10       83 C       <NA>     
11     11       90 C       <NA>     
12     12       84 C       <NA>     

Right Outer Join

Join all the rows of the right table and the matching rows in the left table.
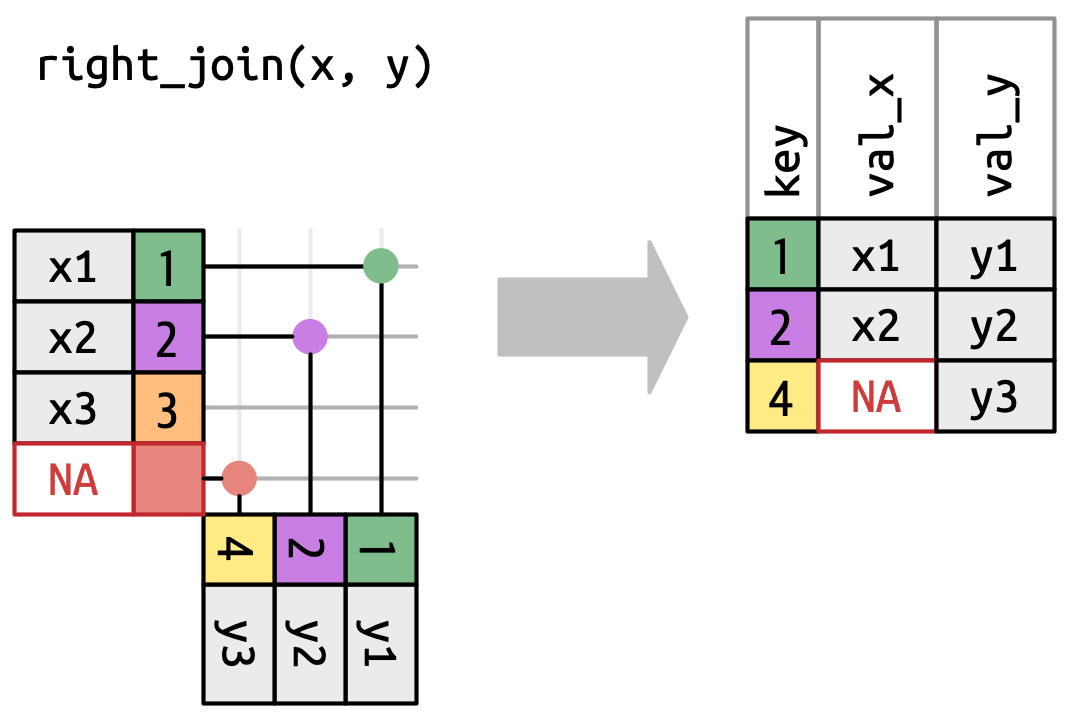
Chart showing how right join works. Left side table has key id 1, 2, 3 and variable x 1, 2, 3. The right side table has id 1, 2, 4 and variable y 1, 2, 3. The joined data has all ids from right side table, 1, 2, 4, along with y 1, 2, 3, ids 1 and 2 have x 1 and 2 and for id 4, x is NA.

right_join()

right_join(employee_dat, department_dat, by = "dept_id")
# A tibble: 10 × 4
   emp_id surv_scr dept_id dept_name
    <int>    <dbl> <chr>   <chr>    
 1      1       73 A       Analytics
 2      2       75 A       Analytics
 3      3       90 A       Analytics
 4      4       79 A       Analytics
 5      5       86 B       Research 
 6      6       83 B       Research 
 7      7       83 B       Research 
 8      8       85 B       Research 
 9     NA       NA D       HR       
10     NA       NA E       Admin    

Inner Join

Join the rows which are present in both tables.
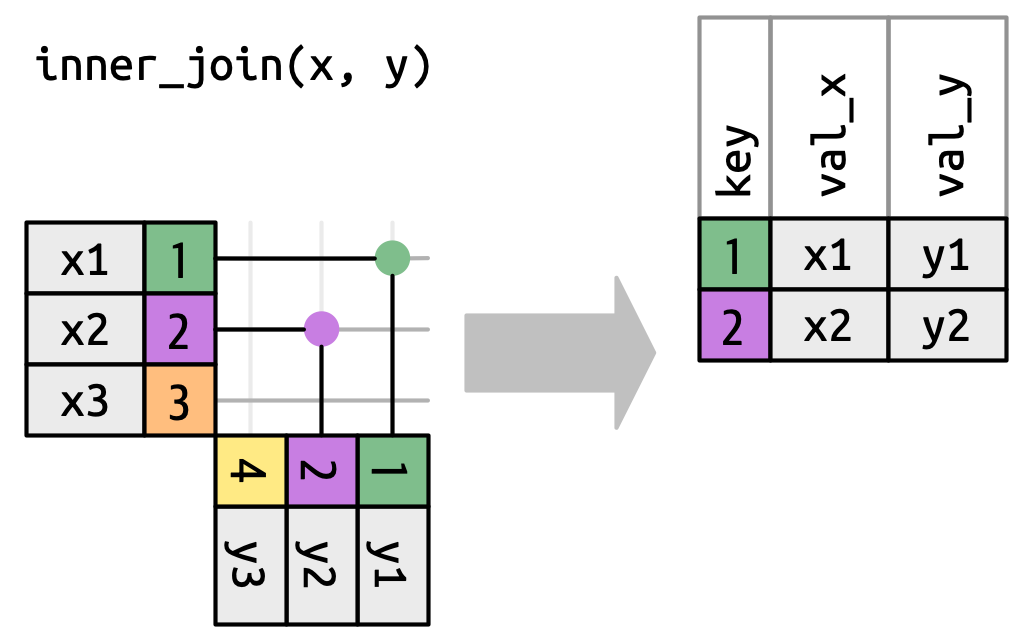
Chart showing how inner join works. Left side table has key id 1, 2, 3 and variable x 1, 2, 3. The right side table has id 1, 2, 4 and variable y 1, 2, 3. The joined data has id 1 and 2 along with the relevant x and y data. The two ids are in both table.

inner_join()

inner_join(department_dat, employee_dat, by = "dept_id")
# A tibble: 8 × 4
  dept_id dept_name emp_id surv_scr
  <chr>   <chr>      <int>    <dbl>
1 A       Analytics      1       73
2 A       Analytics      2       75
3 A       Analytics      3       90
4 A       Analytics      4       79
5 B       Research       5       86
6 B       Research       6       83
7 B       Research       7       83
8 B       Research       8       85

Cross Join or Cartesian Join

Returns all possible combinations of all rows.

cross_join()

cross_join(employee_dat, department_dat)
# A tibble: 48 × 5
   emp_id surv_scr dept_id.x dept_id.y dept_name
    <int>    <dbl> <chr>     <chr>     <chr>    
 1      1       73 A         A         Analytics
 2      1       73 A         B         Research 
 3      1       73 A         D         HR       
 4      1       73 A         E         Admin    
 5      2       75 A         A         Analytics
 6      2       75 A         B         Research 
 7      2       75 A         D         HR       
 8      2       75 A         E         Admin    
 9      3       90 A         A         Analytics
10      3       90 A         B         Research 
# ℹ 38 more rows

Filtering Joins

Semi Join

Filter records from left table that has matching records in right table.

semi_join()

semi_join(employee_dat, department_dat, by = "dept_id")
# A tibble: 8 × 3
  emp_id surv_scr dept_id
   <int>    <dbl> <chr>  
1      1       73 A      
2      2       75 A      
3      3       90 A      
4      4       79 A      
5      5       86 B      
6      6       83 B      
7      7       83 B      
8      8       85 B      

Anti Join

Filter records from left table that do not have matching records in right table.

anti_join()

anti_join(employee_dat, department_dat, by = "dept_id")
# A tibble: 4 × 3
  emp_id surv_scr dept_id
   <int>    <dbl> <chr>  
1      9       81 C      
2     10       83 C      
3     11       90 C      
4     12       84 C      

Thank you!